
Connected Intelligence: Unlocking Hidden Relationships with Graph Analytics in Microsoft Fabric

Introduction
In today’s data-driven world, organizations have mastered collecting data — but most still struggle to understand how their data is connected and why certain business outcomes occur.
Traditional analytics answers what happened.
Graph Analytics answers why it happened.
During our recent session — the first partner-led deep dive on Graph Analytics in Microsoft Fabric — we explored how graph thinking transforms enterprise intelligence, how Neo4j integrates with Fabric, and how Graph + AI unlocks contextual decision-making. This blog captures the key insights and architectural patterns from that session.
What, Why, How – Graph Analytics
Modern Enterprises are increasingly distributed, interconnected, and real-time. The biggest challenges today — fraud, patient journeys, supply chain disruptions, cybersecurity, personalization — are relationship problems, not table problems.
Yet most analytics platforms still rely on rows and columns.
Graph Analytics provides a new lens. It reveals:
- Dependencies
- Influence
- Hidden clusters
- Paths and impact chains
- Behavioral relationships
This shift — from analyzing data points to analyzing connections — marks the beginning of Connected Intelligence.


What is Graph Analytics?
Graph Analytics transforms data into a network of relationships, revealing hidden patterns and enabling connected intelligence for smarter decisions.
By modeling real-world networks directly, graphs make it easy to analyze:
- Pathfinding
- Community structures
- Centrality roles
- Hidden behavioral patterns
— all without heavy joins or complex SQL.
Graph Analytics models data as:
- Nodes → entities (patients, customers, products, devices)
- Edges → relationships (visited, purchased, depends-on, prescribed)
- Properties → metadata on nodes and edges
This allows queries such as:
- “Who is influencing whom?”
- “What path does a problem follow?”
- “Which products are bought together?”
- “Which patients share similar risk patterns?”
Evolution of Graph Analytics
From academic graph theory to enterprise-scale connected intelligence, graph analytics has evolved into a pillar of modern data science and AI.

Graph Use Cases Across Industries
Healthcare
- Patient journey analysis
- Treatment effectiveness paths
- Doctor → device → drug batch →patient complication patterns
- Care coordination graphs
Retail
- Product affinity networks
- Customer similarity clusters
- Store influence patterns
- Promotion impact chains
Fraud Detection
- Shared devices
- Suspicious money movement paths
- Account networks
- Fraud rings and collusion clusters
Supply Chain
- Upstream/downstream dependencies
- Multi-tier supplier risk
- Disruption propagation
Manufacturing
- Equipment Failure Chains
- Maintenance Prediction
- Supply Chain Traceability
- Production Line Bottleneck Detection
Cybersecurity
- Lateral movement paths
- Device relationships
- Identity and access graph
Lets take Recommendation Engine as example
Example: You buy a laptop.
Other users who bought a laptop also bought a mouse and backpack.
Graph reveals this by connecting:
- Users → Products they purchased
- Products → Categories they belong to
- Users → Similar Users based on behavior
- Products → Co-purchase Links
This forms a product affinity graph.
Why Graph Helps
Graph instantly identifies:
- Products frequently bought together (co-purchase patterns)
- Users with similar preferences (behavior clusters)
- Items that appear along the same shopping journey
Instead of simple recommendations like “People also bought…”,
Graph enables contextual, personalized recommendations based on real relationship patterns.

Neo4j Graph Database
Neo4j is a leading graph database that enables powerful analytics and real-time insights. Its Cypher query language makes it easy to explore complex relationships, and its scalability supports enterprise workloads.
MATCH (p:Patient)-[:VISITED]->(d:Doctor)
RETURN p, d
Designing Graph Tables
Do we need to redesign entire database or create new “graph-specific” tables? The Answer is No.
Your existing relational schema usually contains everything required.
- Fact / transaction tables –> Edges
- Dimension / master tables –> Nodes
You simply map existing tables into a graph structure—no duplication or re-engineering.
Graph Analytics in Microsoft Fabric
Microsoft Fabric now brings native graph capabilities directly into the Lakehouse, enabling you to model, query, and visualize relationships without moving or duplicating data.
Fabric Graph Capabilities:
- Graph Modeling → Define node and edge tables directly from your existing Lakehouse tables
- Querysets → Run graph queries using familiar Cypher-like syntax
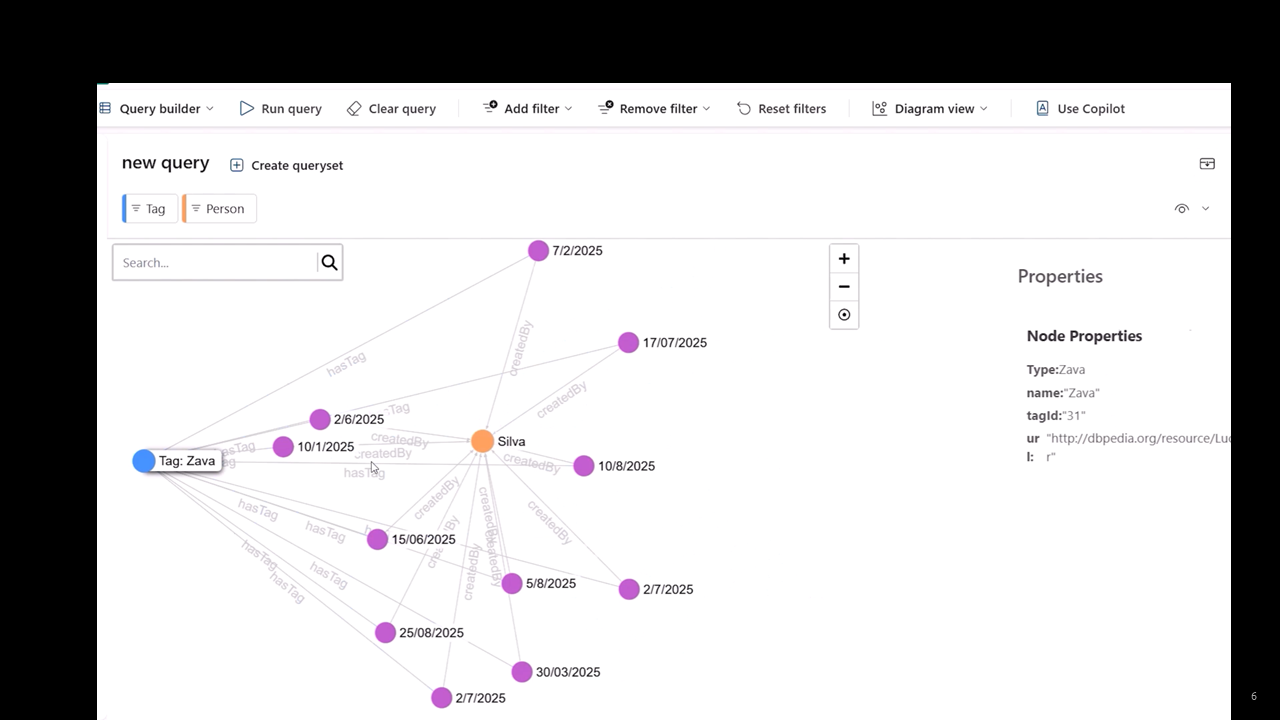
- Graph Explorer → Interactively visualize nodes, edges, and multi-hop relationships
- Real-Time Intelligence integration → Automatically create or update edges from streaming events
- Power BI support → Build network, affinity, and relationship-based visualizations in reports
Fabric does this without separate clusters or complex pipelines—no data movement, no ETL duplication. Everything runs on one unified, connected data foundation.

How Graph Analytics Works in Fabric
Graph Analytics in Fabric follows a simple, intuitive workflow:
- Select your Lakehouse and choose the tables you want to model as nodes (entities) and edges (relationships).
- Define nodes and edges by mapping columns—no need to redesign schemas or create new tables.
- Save your graph model, making it available for querying and visualization.
- Open a Queryset and select the nodes and edges you want to explore.
- Apply filters on properties to refine your graph traversal or narrow the dataset.
- Run graph queries to explore paths, clusters, connections, and relationship insights.
- Use the Code Editor to write custom graph traversals using Fabric’s Cypher-like syntax.
- Publish the graph model to share it with teams or use it in downstream workflows such as AI, Power BI, or Real-Time Intelligence.

Neo4j integration with Fabric
Microsoft Fabric’s integration with Neo4j brings enterprise-grade graph intelligence to the unified Fabric platform.
This integration allows you to:
- Model complex relationships using Neo4j’s Cypher
- Visualize and explore graph structures
- Combine graph analytics with AI for deeper insights
- Streamline workflows between Fabric Lakehouse and Neo4j’s graph engine
How Graph and AI Work Together
- Graph models relationships; AI learns from them.
Graph structures give AI the context it needs to produce smarter, more accurate insights. - AI performs better when it understands connections.
Graphs reveal who interacts with whom, what depends on what, and how information flows. - Graph strengthens core AI capabilities.
> Knowledge graphs → better LLM answers
> Network analysis → fraud & risk detection
> Path analysis → root cause discovery
> Community detection → behavior segmentation
> Centrality → influence scoring - Graph + AI = contextual, explainable intelligence.
Chatbots answer with understanding, search becomes semantic, and recommendations become meaningful. - Graph-Enhanced RAG improves AI reasoning.
AI retrieves documents and traverses graph relationships to provide connected, relationship-aware answers. - With Graph, AI doesn’t just summarize — it explains.
It reasons through relationships, not just text.
Power BI with Graph
Power BI currently has no built-in network graph visual, but graph results can be visualized using custom visuals such as Network Navigator, Social Network Graph, and other force-directed graph visuals available in AppSource.
Conclusion
Graph analytics turns disconnected data points into meaningful networks. With Microsoft Fabric’s new graph capabilities—and seamless integration with Neo4j—organizations can now uncover relationships, strengthen AI models, and drive smarter business outcomes with a unified data foundation.
While the feature is still in public preview and comes with a few limitations, the early capabilities already demonstrate strong potential. As Fabric moves toward General Availability (GA), the graph engine is expected to mature significantly, unlocking even deeper insights and richer analytics experiences.
The future of analytics is connected—graphs turn data into Clarity.
Contact us today to explore how Microsoft Fabric and graph intelligence can unlock deeper, smarter decisions by revealing the hidden relationships in your data.

Elayaraja Eswaran
Senior Vice President - Data and Analytics at iLink Digital
Author
Elayaraja Eswaran, Senior Vice President of Data & Analytics at iLink Digital, brings over two decades of experience in shaping data-driven strategies and delivering enterprise transformation. He is recognized for his expertise in Microsoft Fabric, Azure Data & AI, and Generative AI, and has led global teams across architecture, practice leadership, and alliance management. With a passion for technology evangelism and business impact, Elayaraja is committed to helping organizations harness the power of data and AI to drive measurable outcomes and growth.